Projects
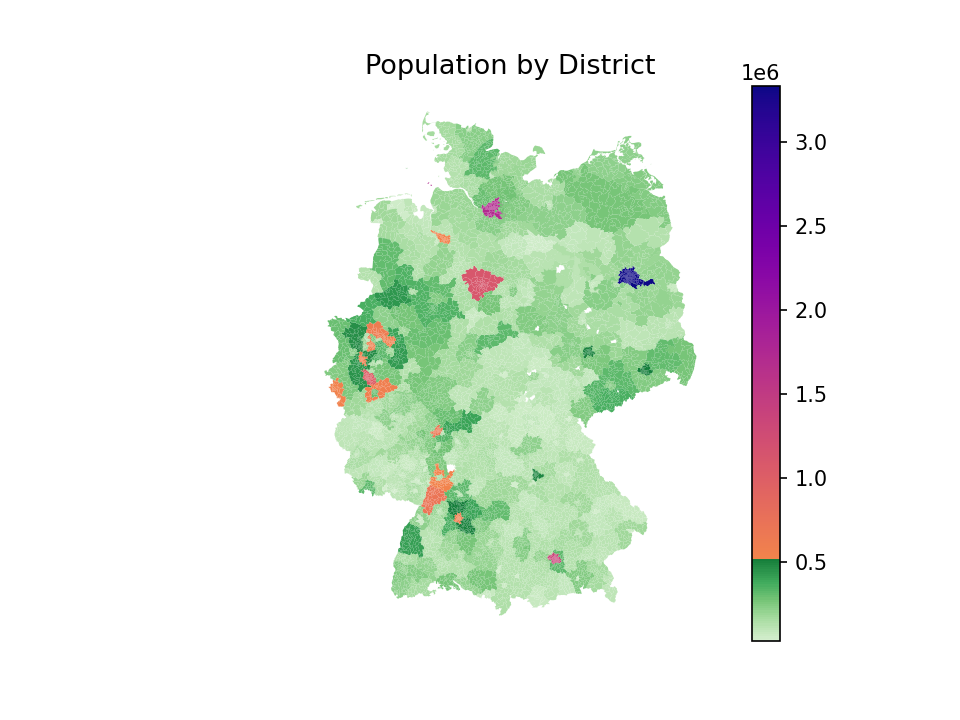
Historical rent analysis:Analysis of historical rental data in Germany and price outlier detection (ongoing).
The purpose of this project is to study the evolution of rental princes and the detection of outliers. Eventually i'd like it to be a tool for people to estimate if a property of their interest is reasonably priced.
Tech & skills: Data analytics, Data science, Python, Scikit-learn, Pandas, geopandas, Jupyter-notebook.

Bird migration:Visualization of bird migration data. (needs updating)
Tech & skills: SQL, Tableau , Data visualization.
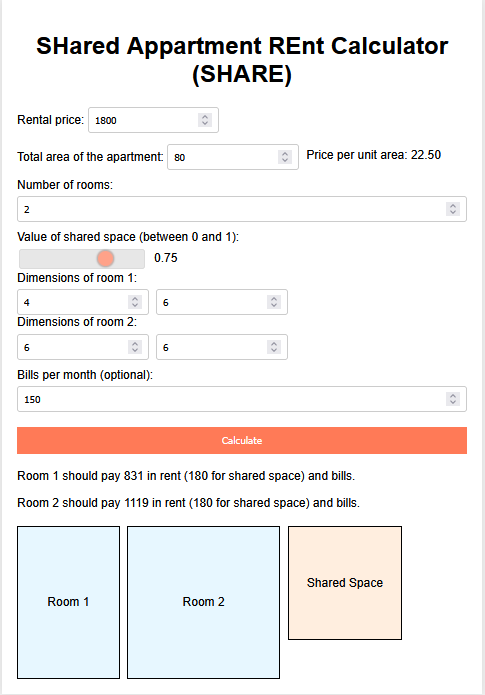
SHared Appartment REnt Calculator (SHARE):Simple calculator to approximate the share of rent each tenant should pay, given the area of their room and the total rent of the appartment. It is also possible to add extra shared taxes like intenet or council tax to the calculation for budgeting purposes. The app Is inspired by my experience trying to find a accomodation in cities where rent is very high and sharing accomodation is commonplace. It is meant to be a first guess at what a fare share of rent would be for each flatmate. It doesn't take into account features like insuite bathrooms, balcony, etc..
Tech & skills: Javascript, HTML
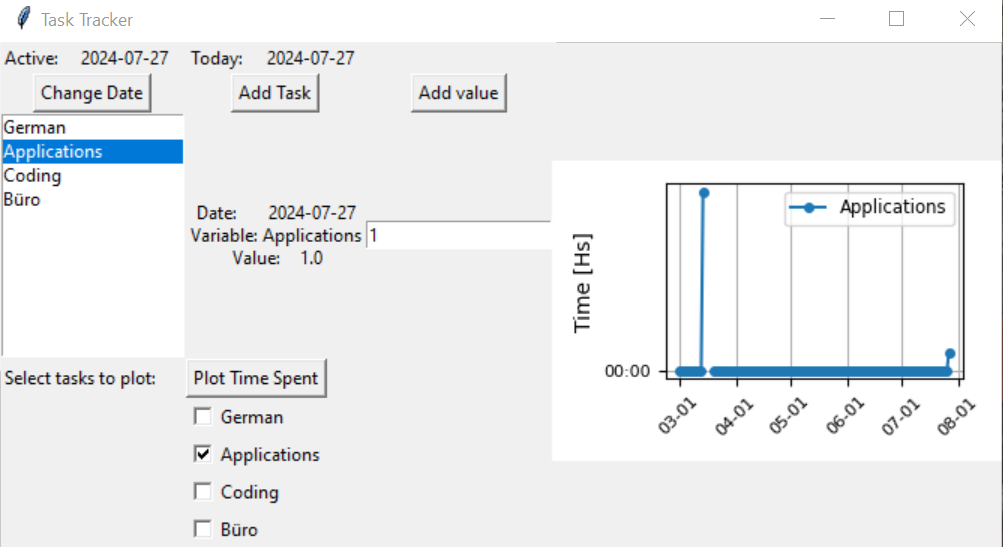
Task Tracker: Python app to track time spent on tasks. One can add what taks it wished to track, and the amount to time spent on each task each day. It is meant to be a tracking app for desktop only, to avoid interactig with a phone. It also allows to plot time spent on each task, to be able to visualize progress and consistance.
Tech & skills: Full stack, Python, Pandas, json
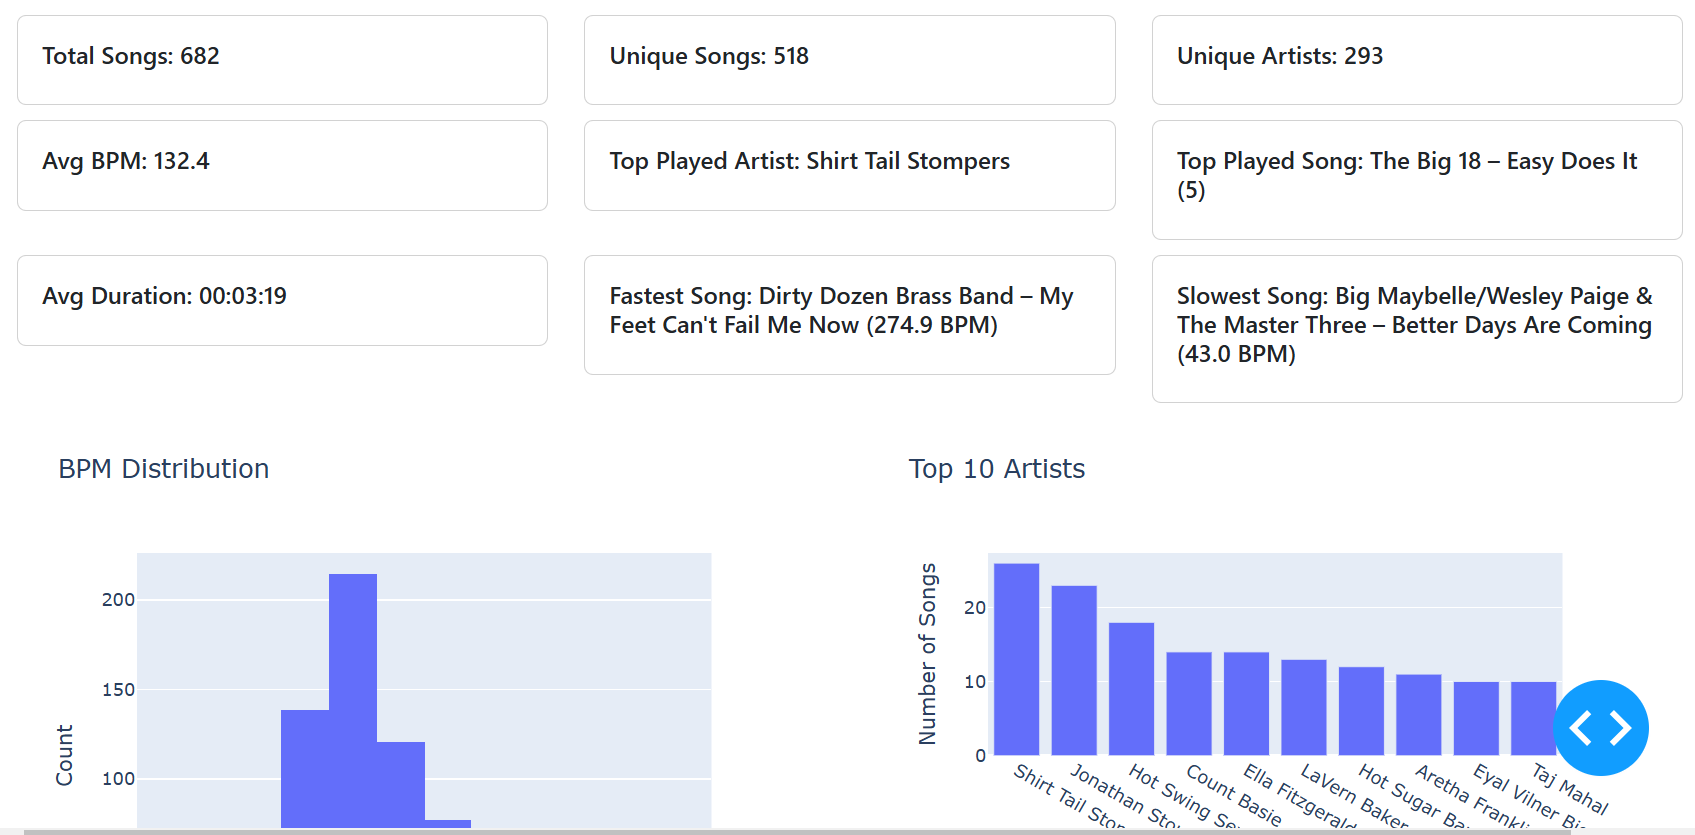
MIXX swing dj set extension: It is meant to complement my use of MIXXX as a tool for DJ-ing at swing and blues social dance events, as a ways to explore and analyze my library and my sets, and reflect on my choices and posibly give me new ideas to explore. This program uses SQlite and Dash to generate a dashboard from a query of "mixxxdb.sqlite", a file that contains the metadata of my MIXXX library and playlists.
Tech & skills: Data analysis, data visualization, Python, Dash, Plotly, SQL.
Plots and visualizations
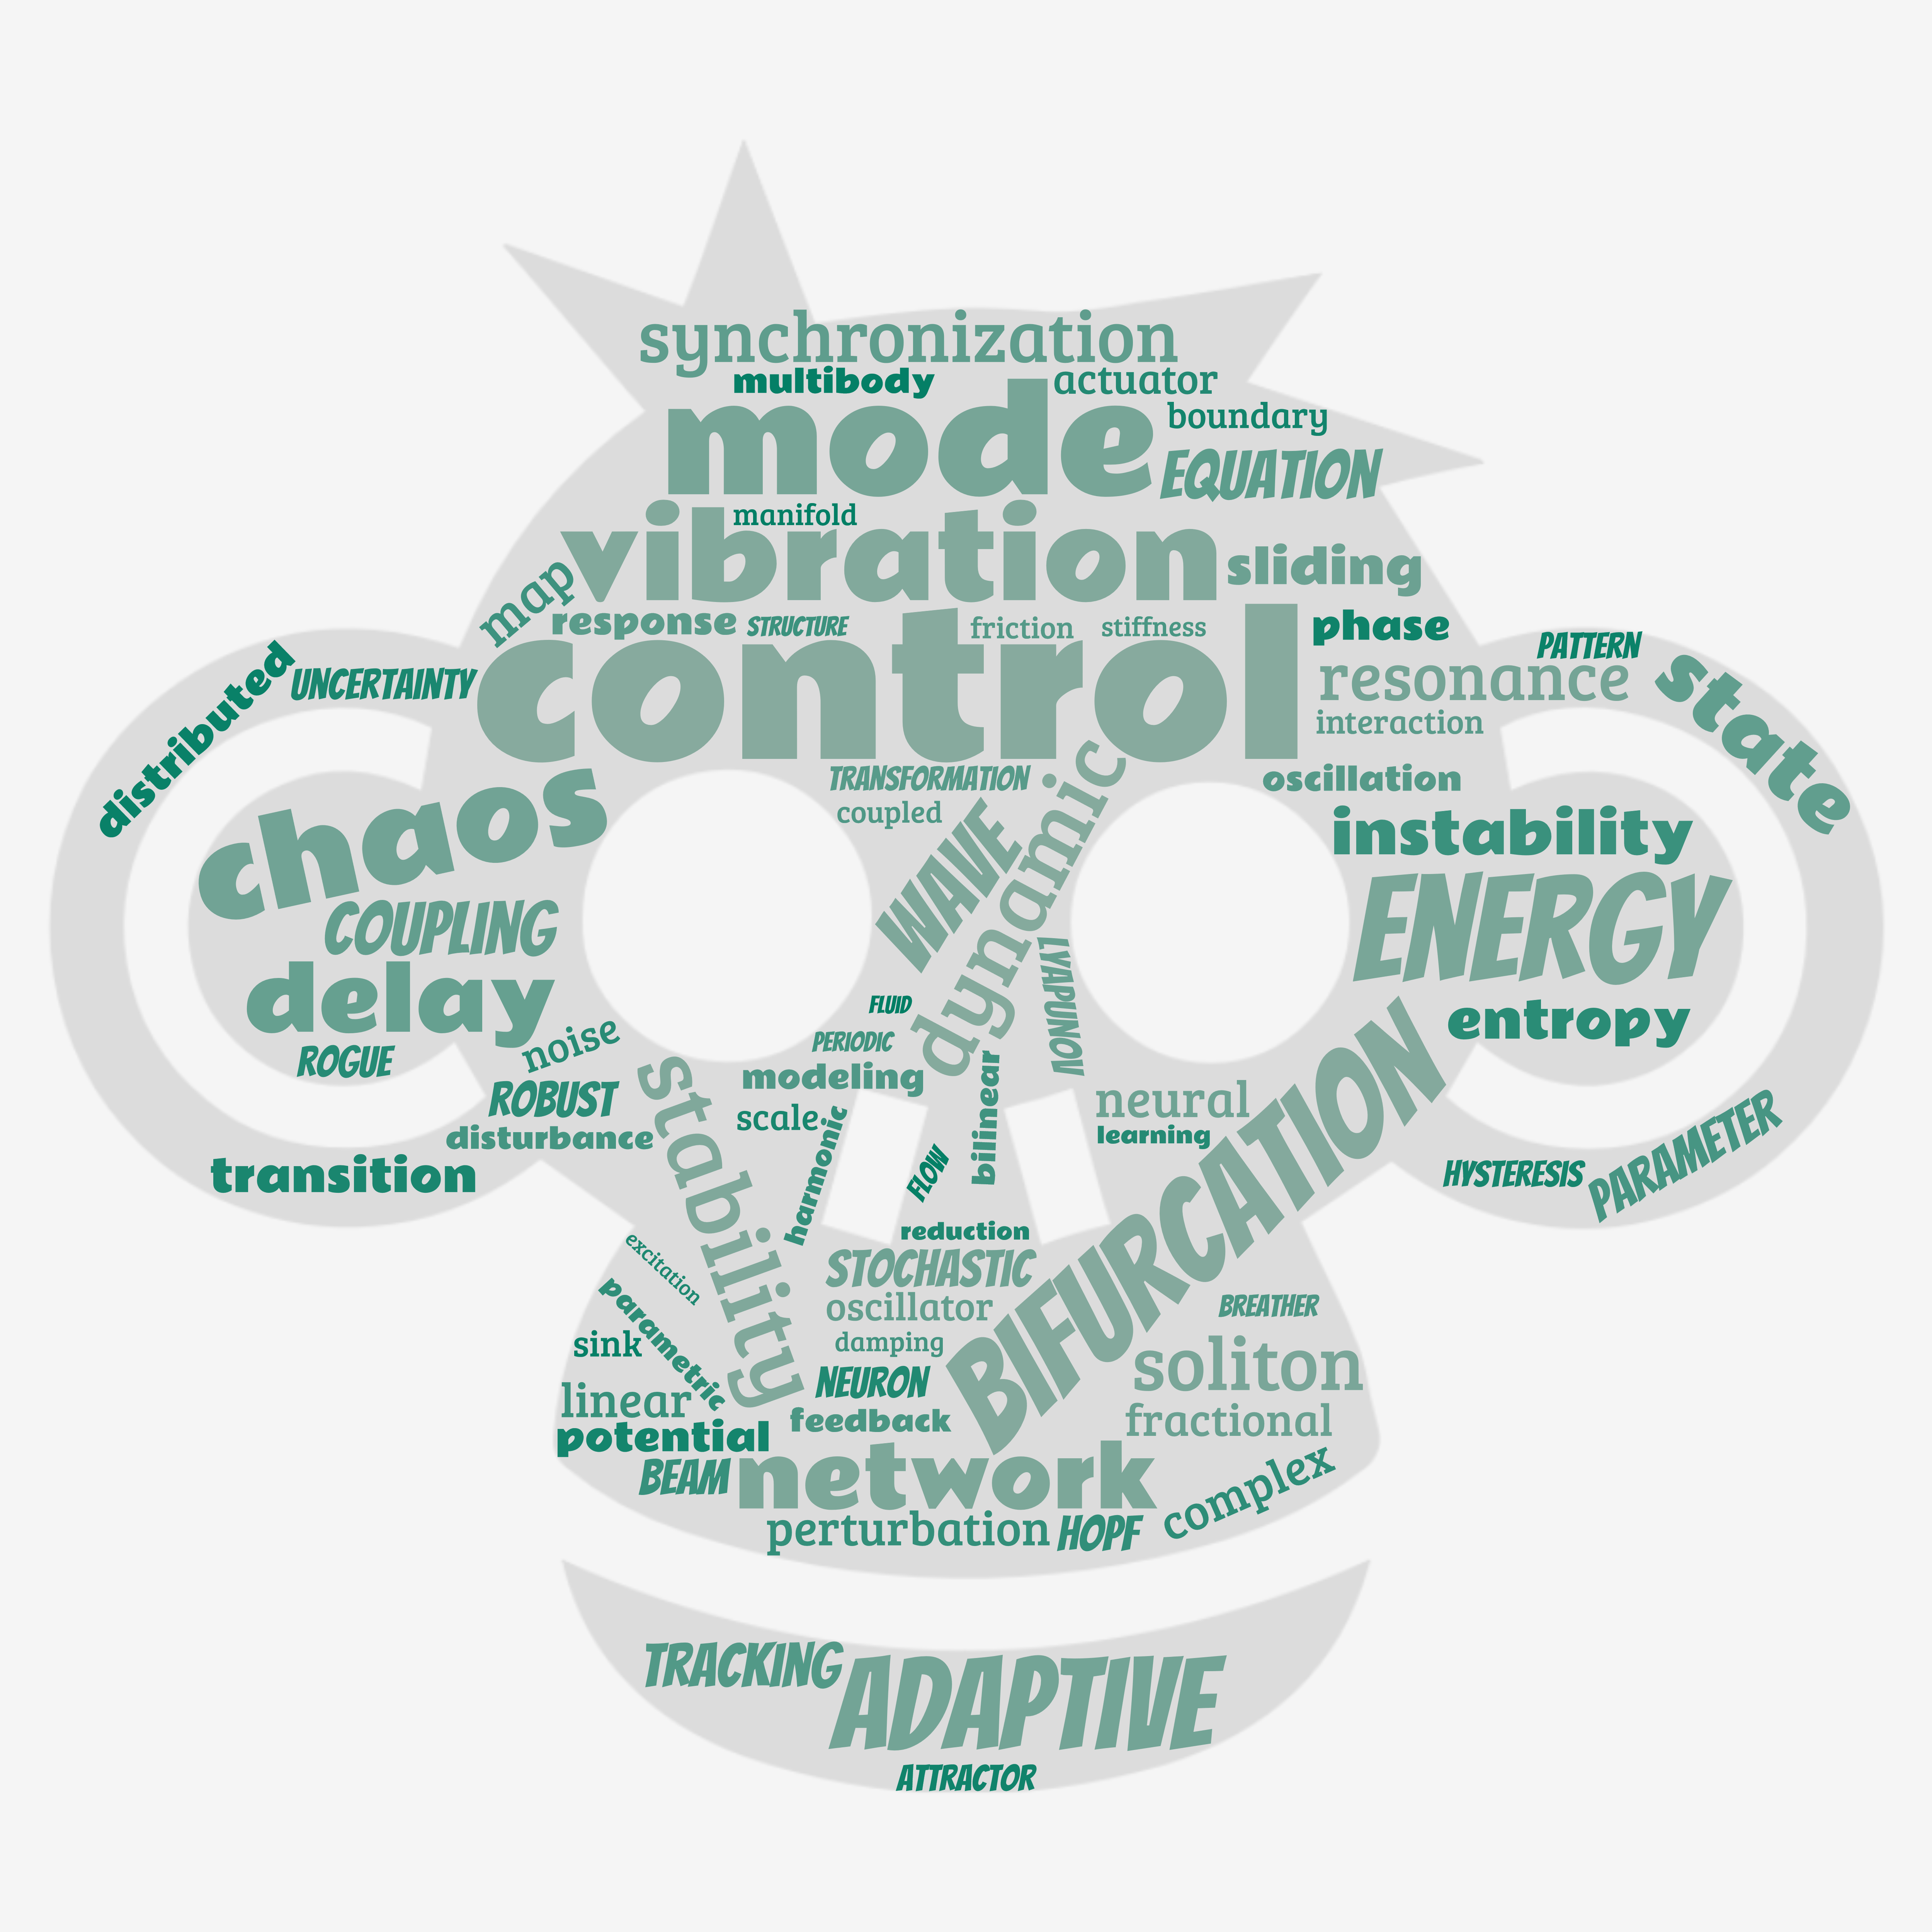
Nonlinear Systems Worldcloud: Wordcloud of keywords appearing in all the articles of the journal of nonlinear dynamics since 2020. Click on the image link to access the Github project with the source code. This project is inspired by this quote:
“Using a term like nonlinear science is like referring to the bulk of zoology as the study of non-elephant animals.” – Stanislaw Ulam.
Tech & skills: Webscrapping, Python, Worldsoup, storytelling.
Spring Pendulum: Visualization of the dynamics of the spring pendulum system
Tech & skills: Data visualization, Python, Matplotlib.
3 Wave stabilization: Modulational instability animation. Showing the nonlinear interation between frequencies of a propagating wave in a self-focusing regime.
Tech & skills: Data visualization, Differential equations.
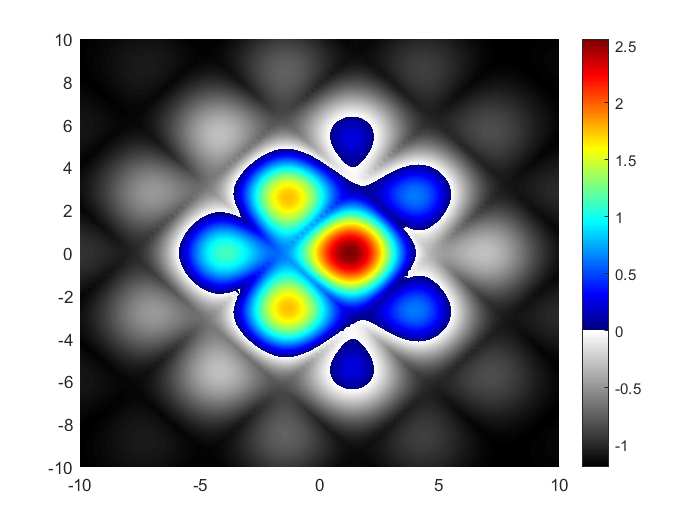
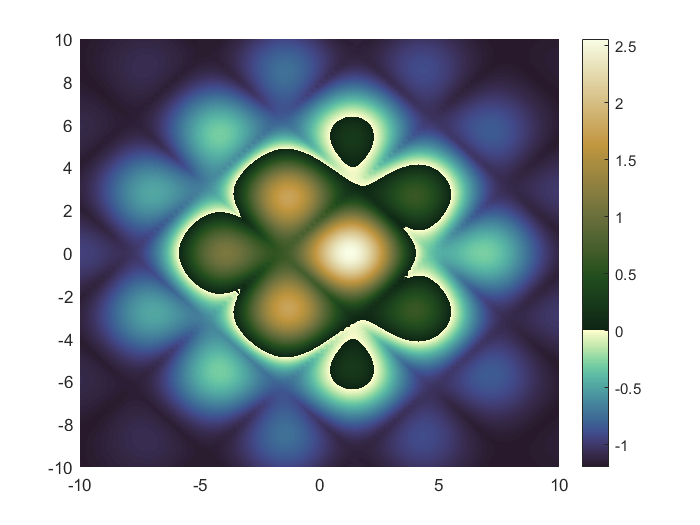
Custom colormaps code: This is a Python and Matlab code to make a new colormap by stitching together two pre-existing colormaps. It allows joining two diverging colormaps, but being able to change the colorbar limits and the pivot point of the divergence.
It is usefull for data that has relevant information in very different ranges, or has a natural threshold that divides the data (For example topography with a water level.) Click on the image link to access the github repository.
Tech & skills: Data visualization, Python, Matlab.
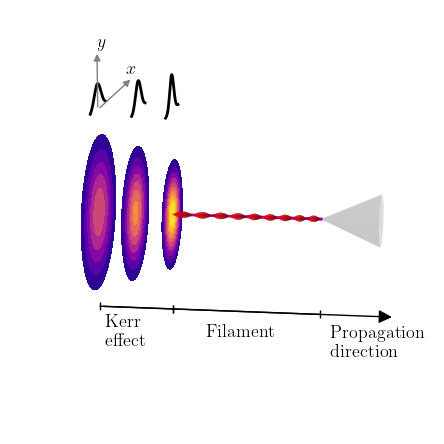
Laser filamentation scheme 3d Laser filamentation scheme made in Python.
Tech & skills: Data visualization, Dessign, Python, Matplotlib.
My photography social media
You can peep a bit of my photography on my instagrams